This is a major piece of functionality, which may change the way you view the data in your databases.
to chart a table, display the table then click on the Chart button
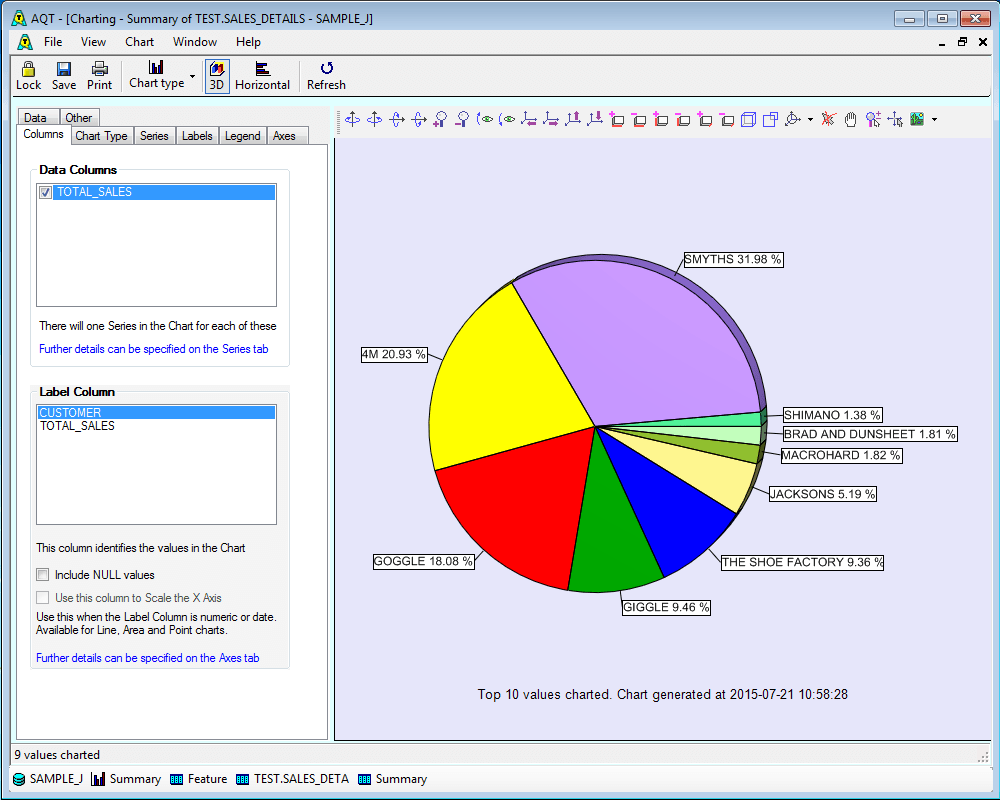
this will show you the Chart Builder window, where you can build your chart in a few clicks.
you can Save your chart and reapply it to your data at a later time.
Building a chart in AQT
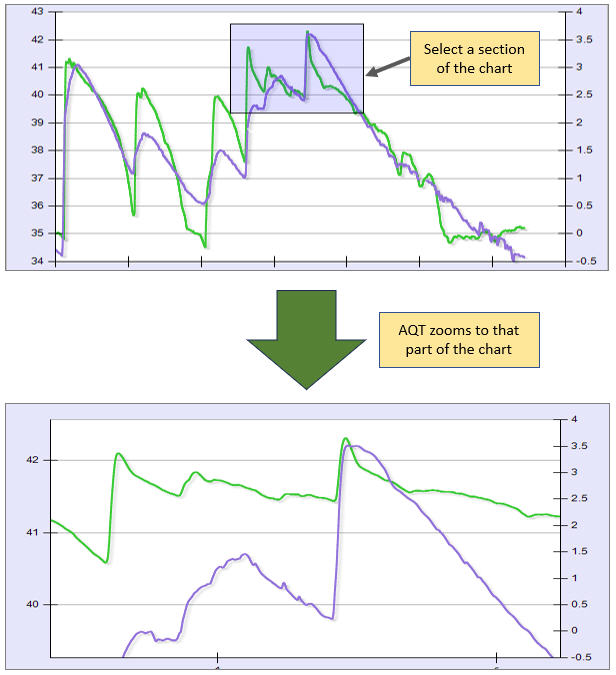
Data Zooming
With AQT v11.0.7 we have added Data Zooming. With this, you can select an area of the chart, and the chart zooms to display that area.
Data Zooming in Charts
Saved Charts
Once you have saved a Chart:
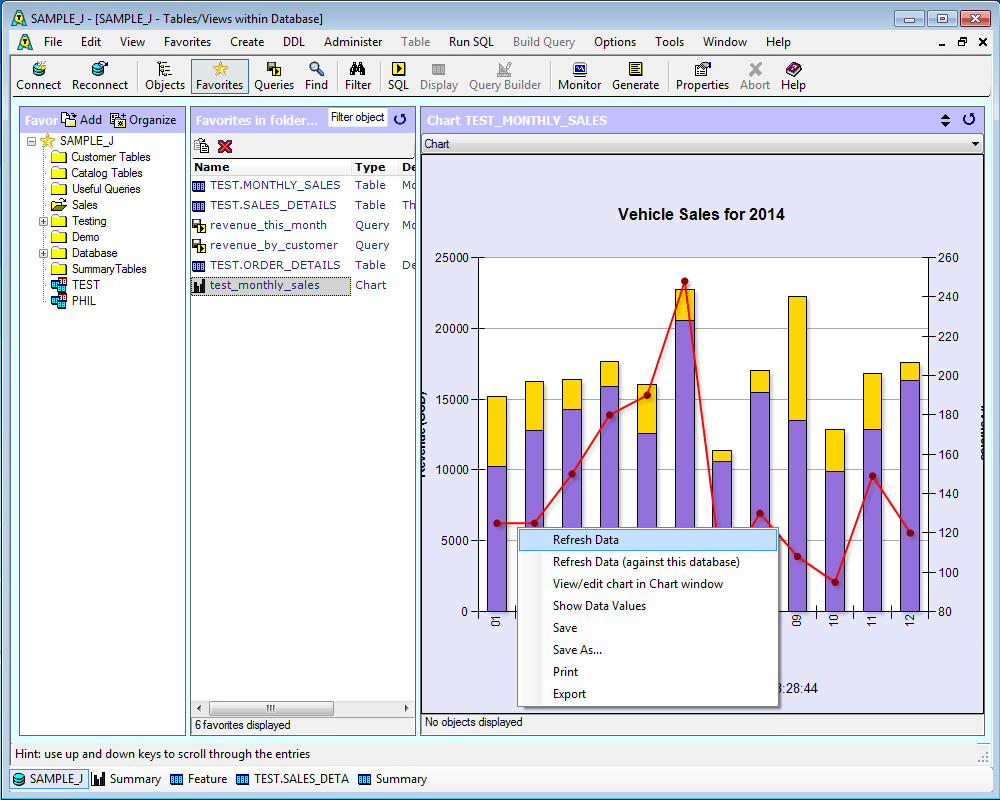
it will appear in the Queries display in the Database Explorer window. You can easily view all the charts that you have developed and saved
you can define a Chart as a Favorite
the data behind the chart can be refreshed by right-clicking the chart and selecting Refresh
a saved Chart is contained within a file. This includes the definition of the Chart plus the query that was run to populate the data. Chart files can be manipulated like normal files - you can move them around on your machine or distribute them to your colleagues. A chart can operate both as snapshot of your data at a particular time, and as a pre-built query that you can deploy to other people.
charts can be created in an unattended batch script
Viewing a Chart as a Favorite in the Database Explorer
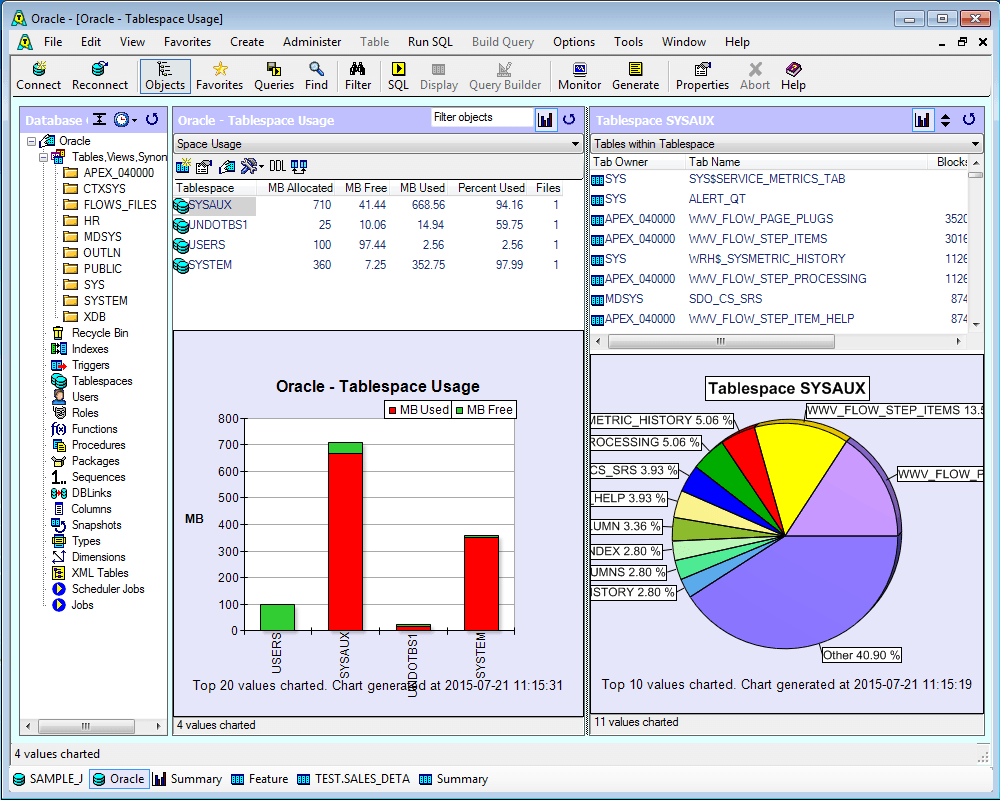
Charts in the Database Explorer
The Database Explorer comes with a number of pre-built charts. The following show both Tablespace Usage within an Oracle tablespace.